Compare two properties side by side: land area, frontage, and proximity
On this page
Two listings, two browser tabs, and a mental spreadsheet that never quite holds all the numbers at once - land area in one tab, frontage scribbled on a notepad, the powerline distance from a search you did an hour ago. Pin two addresses on MapMyLot instead and see them compared in a single table - land area, perimeter, unconstrained area (MapMyLot's on-screen term for buildable area - title area minus mapped exclusionary constraints), frontage, and every proximity signal - side by side, metric by metric.
Compare two properties with MapMyLot Pro
Open the map to compareSide-by-side comparison requires Pro. You can check the first address free before deciding whether to upgrade.
How to run a comparison
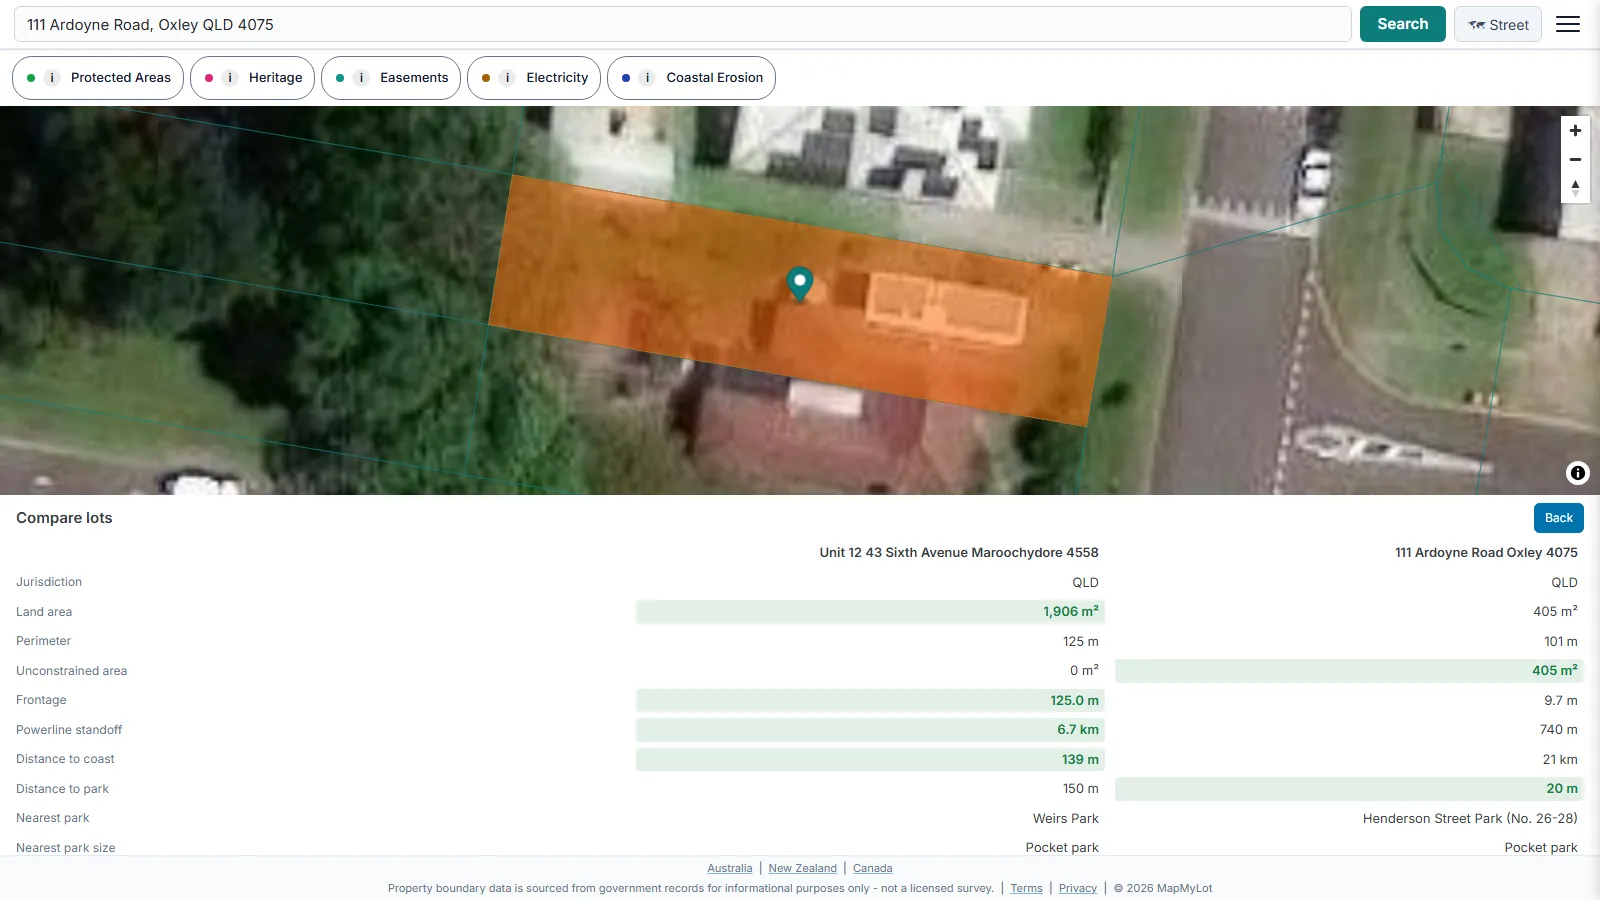
Search the first address and tap Pin to compare. Search the second address, then tap Compare vs [first address]. The compare view opens in the info panel with both properties side by side, metric by metric.
What gets compared
The table combines mapped measurements and estimates: jurisdiction (shown for reference, not highlighted), land area in square metres, perimeter in metres, unconstrained area (buildable area) where a coverage jurisdiction has backfilled it, primary frontage in metres, distance to the nearest high-voltage (33kV+) power line, distance to the coast, distance to the nearest park plus its name and size tier, and both the count and total hectares of parkland within 1 kilometre.
How the highlight works
A metric only highlights a winner when both properties have a value for it, the values actually differ, and the metric has a meaningful direction - larger land area wins, shorter distance to the coast wins, greater powerline standoff wins. A value missing on either property never wins a highlight by default, and a metric absent on both properties is left off the table entirely rather than shown as a blank row.
Why compare instead of checking one at a time
Two listings can each look reasonable in isolation but differ meaningfully once placed side by side - one with more unconstrained area, the other closer to the coast, a third quieter but further from a park. The comparison table surfaces those trade-offs directly instead of requiring two separate searches held in your head at once.
Note: comparison metrics are only as complete as the underlying government data for each jurisdiction - see ICSM, the intergovernmental cadastre coordination body for background on Australia's national geospatial data programs. A blank cell means no data was available for that property, not that the value is zero.
Related checks
See a property's full proximity to power lines, flood zones, the coast, and parks, check a Queensland or New South Wales boundary before you compare two lots, or see how MapMyLot's comparison feature stacks up against Landchecker, which has no equivalent side-by-side view.
Start with one address, then compare with Pro
Check the first property's boundary and lot size free. If you need the side-by-side table, sign in with Pro, pin that property and search the second. Read missing values as unavailable data; the highlighted value follows the app's comparison rule and may not be the better choice for your needs.
Compare two properties with MapMyLot Pro
Open the map to compareSide-by-side comparison requires Pro. You can check the first address free before deciding whether to upgrade.
Frequently asked questions
How do I compare two properties on MapMyLot?
Which metrics does the comparison show?
Why does a metric sometimes show no winner?
Is my area included?
The compare view works everywhere MapMyLot has cadastral coverage:
- Australia: Queensland, New South Wales, Victoria, Tasmania, and the ACT
- Canada: British Columbia, Manitoba, New Brunswick, and Yukon
- New Zealand
- UK: England, Wales, and Scotland
Individual comparison rows (unconstrained area (buildable area), frontage, powerline, coast, and park distance) follow each metric's own coverage, so a row can be blank on one or both properties even inside a covered jurisdiction.